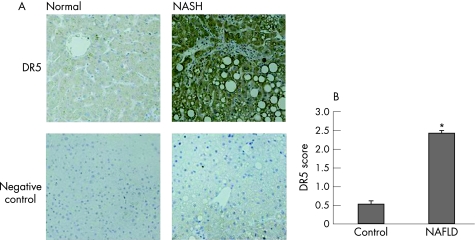
Figure 6 DR5 expression in human liver samples from patients with NASH. (A) Immunohistochemistry was performed for DR5 expression using liver biopsy samples from patients with NASH. Normal liver biopsy samples were used as controls. Representative photomicrographs (original magnification ×200) demonstrate upregulation of DR5 expression in NASH compared to normal liver. (B) DR5 score was calculated based on the scoring system described in the methods section. Two or more random high power fields were scored per sample by two independent observers. Significant increase in DR5 expression in hepatocytes was observed in liver tissue from patients with NASH (p<0.001).

An official website of the United States government
Here's how you know
Official websites use .gov
A
.gov website belongs to an official
government organization in the United States.
Secure .gov websites use HTTPS
A lock (
) or https:// means you've safely
connected to the .gov website. Share sensitive
information only on official, secure websites.
