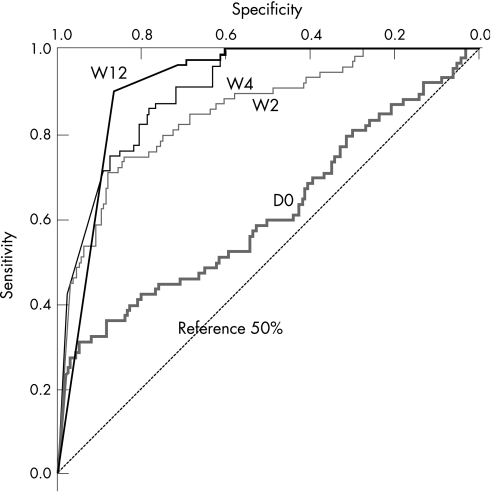
Figure 2 Receiver operating characteristics (ROC) curves for HCV RNA quantification in HIV/HCV co‐infected patients at baseline (D0) and at week (W) 2, W4 and W12 of pegylated‐interferon α2b plus ribavirin therapy. The optimal cut‐off levels at W4 and W12 for non‐sustained response were calculated to be 460 000 IU/ml (5.6 log) and 39 000 IU/ml (4.6 log), respectively. There was not enough information at D0 and W2 for practical treatment follow‐up. Intra‐assay variation using the branched DNA assay for viral load measures is very low (about 3%) as we reported previously.18 Cut‐off levels would thus vary from 453 000 to 467 000 IU/ml at W4 and from 38 400 to 39 600 IU/ml at W12, within the 95% confident intervals for cut‐off calculation from the ROC curves (310 000 to 610 000 IU/ml at W4 and 30 000 to 48 000 IU/ml at W12). The reference 50% line corresponds to 50% specificity and 50% sensitivity, showing no advantage of the test.

An official website of the United States government
Here's how you know
Official websites use .gov
A
.gov website belongs to an official
government organization in the United States.
Secure .gov websites use HTTPS
A lock (
) or https:// means you've safely
connected to the .gov website. Share sensitive
information only on official, secure websites.
