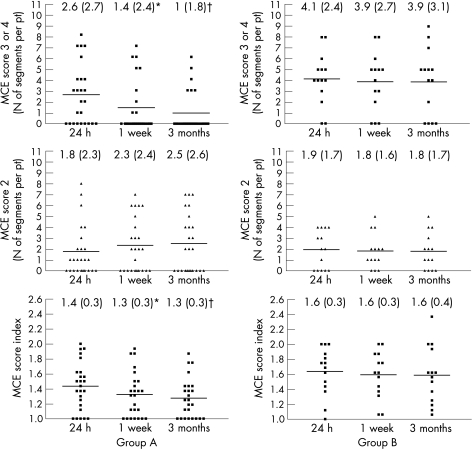
Figure 3 Number of segments per patient (pt) with myocardial contrast echocardiography (MCE) score = 3 (absent perfusion) (top panels), MCE score = 2 (reduced perfusion) (middle panels) and MCE score index (MCESI) (lower panels) for each patient at 24 h, 1 week and 3 weeks after percutaneous coronary intervention in group A (left panels) and B patients (right panels). Although the number of MCE 2 segments did not change over time in the two study groups, the number of MCE 3 segments and MCESI were significantly reduced at 1 week (*p<0.05 vs 24 h) and 3 months (†p<0.005 vs 24 h) only in group A patients. Numbers at the top of each graph represent the mean (SD) for each dataset.

An official website of the United States government
Here's how you know
Official websites use .gov
A
.gov website belongs to an official
government organization in the United States.
Secure .gov websites use HTTPS
A lock (
) or https:// means you've safely
connected to the .gov website. Share sensitive
information only on official, secure websites.
