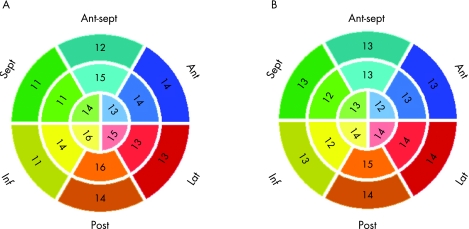
Figure 5 Rates of agreement with the expert grades for each individual endocardial surface segment calculated in 16 patients with wall motion abnormalities for the automated interpretation of wall motion from cardiac magnetic resonance images (A) and real‐time three‐dimensional echocardiography images (B). Ant, anterior; ant sept, antero‐septal; inf, inferior; lat, lateral; post, posterior; sept, septal.

An official website of the United States government
Here's how you know
Official websites use .gov
A
.gov website belongs to an official
government organization in the United States.
Secure .gov websites use HTTPS
A lock (
) or https:// means you've safely
connected to the .gov website. Share sensitive
information only on official, secure websites.
