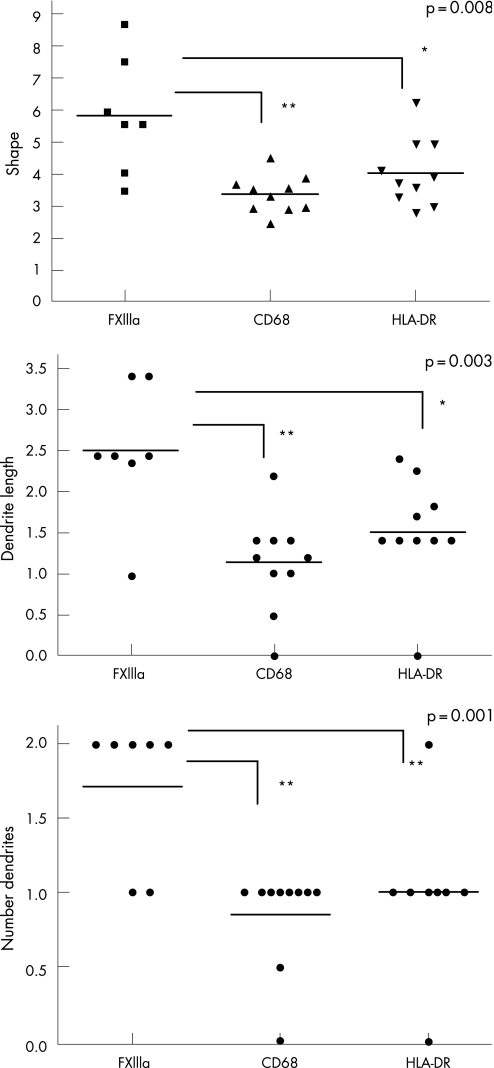
Figure 2 Morphology of antigen‐presenting cells in uveal melanoma. For morphology analysis, high‐power photographs of selected areas of high positive cell concentration (hot spot (HS); area: 0.35 mm2) were taken. The graphs show the coefficient of shape (A), dendrite length (B) and number of dendrites (C) on FXIIIa, CD68 and human leucocyte antigen (HLA)‐DR expressing cells. The dots represent median values for all cells in the HS area. The horizontal line represents the median value for each morphologic feature. The higher the coefficient of shape, the more dendritic the object. The asterisks show the significance of the difference using analysis of variance. *p<0.05, **p<0.01.

An official website of the United States government
Here's how you know
Official websites use .gov
A
.gov website belongs to an official
government organization in the United States.
Secure .gov websites use HTTPS
A lock (
) or https:// means you've safely
connected to the .gov website. Share sensitive
information only on official, secure websites.
