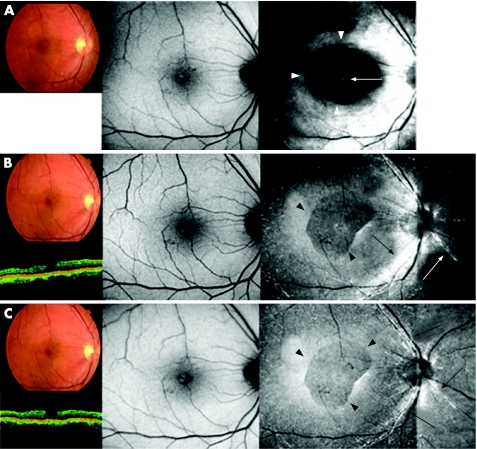
Figure 2 Case 4. Fundus photograph, optical coherence tomography (OCT), autofluorescence image and indocyanine green (ICG) fluorescence images of a patient who underwent vitrectomy for a macular hole (MH) with ICG‐assisted internal limiting membrane (ILM) peeling at the time of surgery (top), 1 month (middle) and 3 months (bottom), postoperatively. (Top left) Fundus photograph and OCT image showing a MH. (Top centre) Autofluorescence image shows hyperfluorescence in the MH bed (white arrow). (Top right) No apparent ICG fluorescence signal is detected, although hyperfluorescence in the MH bed was observed (white arrow). (Middle left and centre) 1 month after surgery, fundus photograph and OCT image show MH closure, and the foveal hyperfluorescence had resolved on the autofluorescence image. (Middle right) ICG hyperfluorescence is seen in the posterior retina with an area of hypofluorescence area (black arrowheads). A faint ICG signal is detected in the MH bed (white arrowhead). (Bottom left and centre) 3 months after the surgery, fundus photograph, OCT and autofluorescence image are unchanged. (Bottom right) Dot ICG hyperfluorescence is observed diffusely in the posterior retina resembling a stardust pattern. Dot fluorescence has accumulated along the artery (white arrows). The area of ILM peeling is clearly identified (black arrowheads).

An official website of the United States government
Here's how you know
Official websites use .gov
A
.gov website belongs to an official
government organization in the United States.
Secure .gov websites use HTTPS
A lock (
) or https:// means you've safely
connected to the .gov website. Share sensitive
information only on official, secure websites.
