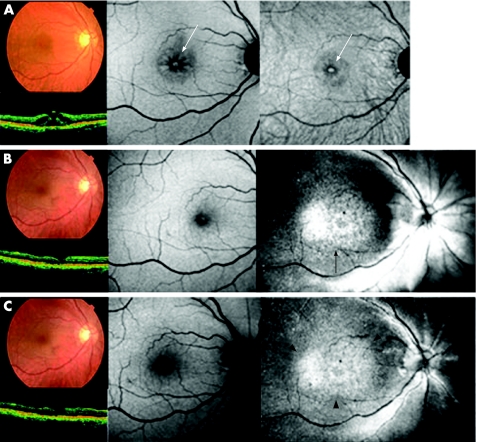
Figure 4 Case 3. Fundus photograph, optical coherence tomography (OCT), and autofluorescence and indocyanine green (ICG) fluorescence images of a patient who underwent vitrectomy for a macular hole (MH) with ICG‐assisted internal limiting membrane (ILM) peeling at 1 month (top), 3 months (middle) and 6 months (bottom), postoperatively. (Top left) Fundus photograph shows MH closure after vitrectomy. (Top centre) Autofluorescence image shows faint foveal hyperfluorescence. (Top right) ICG hyperfluorescence is distributed diffusely at the posterior retina and there is hypofluorescence around the fovea (white arrowheads). Hyperfluorescent spots corresponding to the MH are also observed (white arrow), although the signal is not intense. (Middle left and centre) After 3 months, fundus photograph and OCT image show MH closure and autofluorescence image is unchanged. (Middle right) ICG hyperfluorescence migrates towards the optic nerve disc presumably along the nerve fibre layer (black arrows). The area of ILM peeling during surgery is clearly identified (black arrowheads). Dot hyperfluorescence along the artery near the optic nerve disc is present (white arrow). (Bottom left and centre) After 6 months, fundus photograph, OCT and autofluorescence image are unchanged. (Bottom right) Dot ICG hyperfluorescence is diffusely observed at the posterior retina resembling a stardust pattern. Most of the dot fluorescence is along the artery (black arrows). The area of ILM peeling is still identified clearly (black arrowheads).

An official website of the United States government
Here's how you know
Official websites use .gov
A
.gov website belongs to an official
government organization in the United States.
Secure .gov websites use HTTPS
A lock (
) or https:// means you've safely
connected to the .gov website. Share sensitive
information only on official, secure websites.
