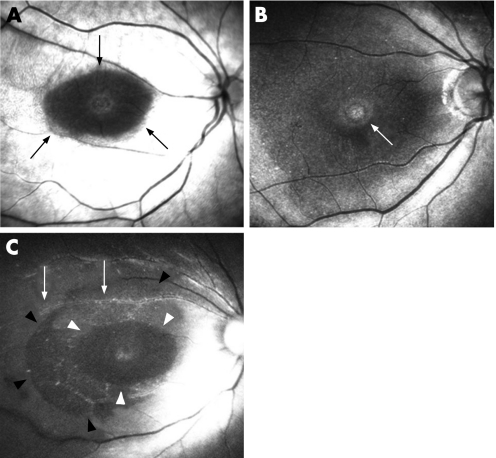
Figure 5 Case 6. Fundus photograph, optical coherence tomography (OCT), autofluorescence and indocyanine green (ICG) fluorescence images of a patient who underwent vitrectomy for a macular hole (MH) with ICG‐assisted internal limiting membrane (ILM) peeling at the time of surgery (top), 1 month (middle) and 3 months (bottom), postoperatively. (Top left) Fundus photograph and OCT image show a MH. (Top centre) Autofluorescence image shows hyperfluorescence in the MH bed and retinal cystic changes (white arrow). (Top right) No ICG signal is seen, although hyperfluorescence is detected in the MH bed (white arrow). (Middle left and centre) 1 month after surgery, fundus photograph and OCT image show MH closure and the foveal hyperfluorescence has resolved on the autofluorescence image. (Middle right) On the ICG fluorescence image, hyperfluorescence is detected in the posterior retina (black arrows), but without an area of hypofluorescence. The ICG pattern seems to be an accumulation of small fluorescent dots, and it may differ somewhat from cases 3 and 4.(Bottom left and centre) 3 months after surgery, fundus photograph, OCT and autofluorescence image are unchanged. (Bottom right) Dot fluorescence is unchanged and is still in the posterior retina (black arrowheads).

An official website of the United States government
Here's how you know
Official websites use .gov
A
.gov website belongs to an official
government organization in the United States.
Secure .gov websites use HTTPS
A lock (
) or https:// means you've safely
connected to the .gov website. Share sensitive
information only on official, secure websites.
