
Figure 1.
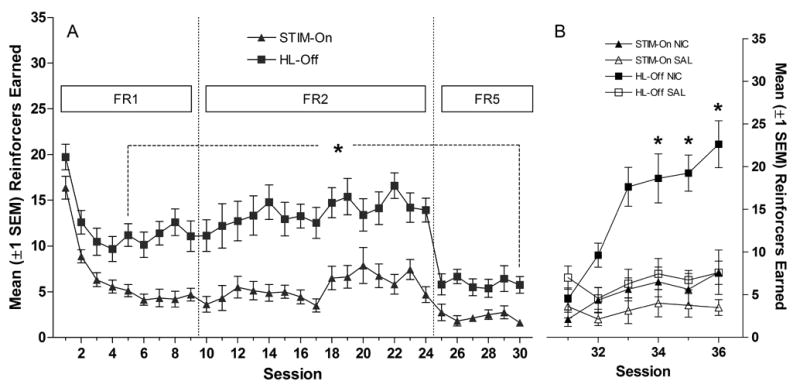
Panel A shows the mean (±1 SEM) number of reinforcers earned during the stimulus comparison phase. Panel B illustrates the mean (±1 SEM) number of reinforcers earned during nicotine/saline testing sessions. * in Panel A indicates reinforcers earned for HL-OFF group differs from STIM-ON group. * in Panel B indicates that reinforcers earned in HL-OFF/NIC group differs from HL-OFF/SAL group.