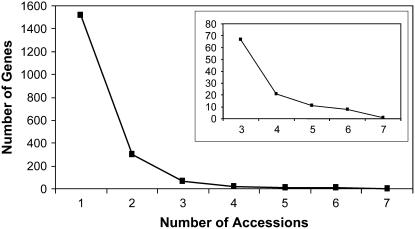
Figure 1.
Variation in Gene Response to SA Treatment in Seven Accessions.
All genes that responded significantly to SA treatment at any time point (4, 28, and 52 hpt) were classified with respect to the number of accessions for which they showed a statistically significant response to SA treatment. The inset shows detail for the genes that responded in three to seven accessions.

