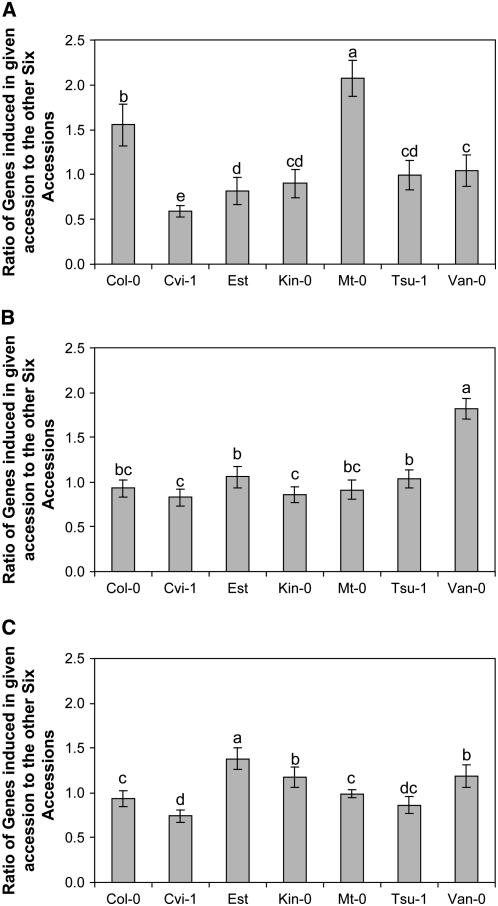
Figure 2.
Hypo- and Hyperresponses to SA Treatment as Measured by Individual Genes.
The number of genes responding to SA in each of the accessions (as detected in the six pairwise analyses) was divided by the number of genes responding in the other accession in the pairwise analysis. Each analysis was conducted independently at each of three time points posttreatment. t tests were used to test for statistically significant differences in the ratio of SA-responsive genes between the seven accessions. Bars represent se. Different letters represent statistically different groupings at P = 0.05.
(A) 4 hpt.
(B) 28 hpt.
(C) 52 hpt.

