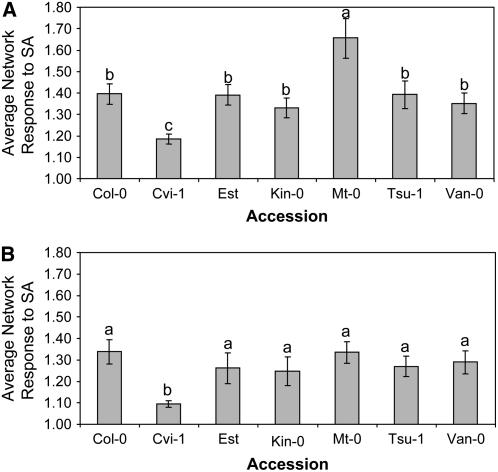
Figure 3.
Hypo- and Hyperresponses to SA as Measured by Gene-Network Variation.
The 25 SA-responsive networks were classified as either up- or downregulated, and the two groups were analyzed separately. For each accession, the average network expression value was obtained for each network from both the control and SA treatments. Only the 4-hpt time point was used. For each accession, the average response of the SA-upregulated networks (A) or SA-downregulated networks (B), respectively, was determined by dividing the mean network expression value under SA by its mean expression value under control conditions. The average value across all networks is presented. t tests were used to detect significant differences between the means; different letters represent statistically different groupings at P = 0.05. Bars represent se.

