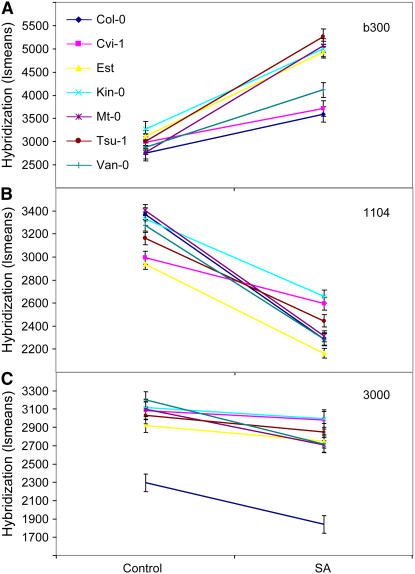
Figure 4.
Gene-Network Expression Response to SA Treatment in Seven Accessions.
The average gene-network expression value under control and SA treatments at 4 hpt for the seven accessions is presented for three example gene networks. Bars represent se.
(A) Variable SA-mediated upregulation in network b300.
(B) Variable SA-mediated downregulation in network 1104.
(C) Gene network 3000 for which Col-0 is significantly different from the other accessions.

