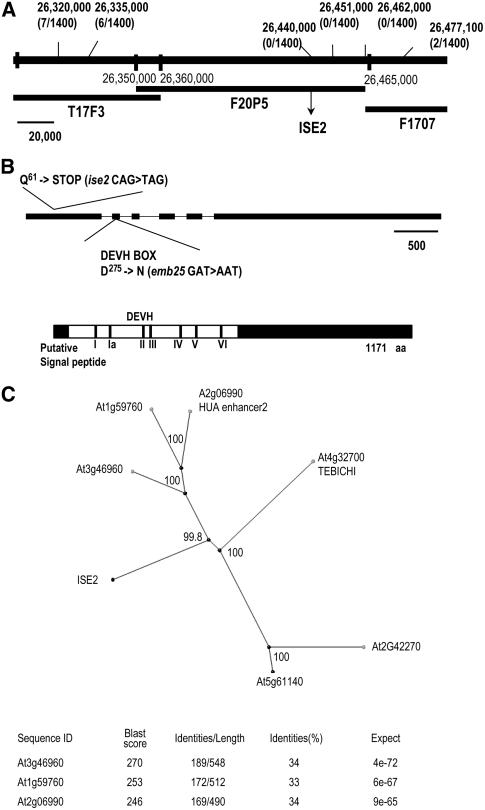
Figure 4.
Mapping and Cloning of the ISE2 Gene.
(A) Genetic and molecular map of ise2. The frequency of recombination between PCR-based cleaved-amplified polymorphic sequence markers in a mapping population of 700 plants was scored. The least frequent recombinants (>0) were six plants with markers positioned at 26,335,000 bp and two plants with markers positioned at 26,477,100 bp. Thus, ise2 maps to the F20P5 BAC genomic region, an interval of 100 kb predicted to contain 31 genes (At1g70220 to At1g70020; www.Arabidopsis.org). Genomic DNA sequencing from position 26,465,000 bp toward the centromere in both homozygous mutants ise2 and emb25 indicated single nucleotide changes at the At1g70070 locus.
(B) Top, model of the ISE2 gene. Exons are shown as black bars. Changes in the amino acid and DNA sequences of ise2 or emb25 alleles are noted. The scale bar represents 500 bp. Bottom, schematic diagram of ISE2 showing the location of a putative signal peptide (small black bar), the helicase motifs within the white region, and the C-terminal region (black). aa, amino acids.
(C) Phylogenetic tree of ISE2 homologs in Arabidopsis using the neighbor-joining BLOSUM 62 matrix (BLASTP) and represented graphically by Jalview software. The Bootstrap statistical analyses were made with the software ClustalX using the Bootstrap Neighbor-Joining Tree function, and calculated percentage significance values are indicated in each branch. At bottom is a list of the closest Arabidopsis homologs with percentage amino acid identity to ISE2.

