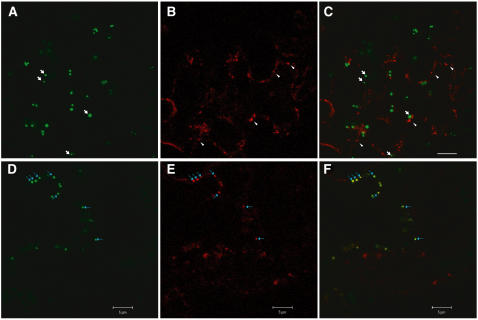
Figure 9.
Subcellular Colocalization Studies of ISE2-GFP and DCP2-RFP.
N. benthamiana leaves were agroinfiltrated with ISE2-GFP and DCP2-RFP and viewed at 48 h after infection. (A) to (C) document one example of an epidermal cell with independent localization of ISE2-GFP granules (white arrows) and P-body DCP2-RFP granules (white arrowheads). DCP2-RFP exhibits a more diffuse signal. (D) to (F) show another example in which ISE2-GFP granules (green) (D) and the P-body DCP2-RFP granules (red) (E) colocalize as yellow foci (F). (A) and (D) show the green GFP channel, (B) and (E) show the red RFP channel, and (C) and (F) show merged images. Blue arrows indicate colocalized granules in (D) to (F). Bars = 10 μm for (A) to (C) and 5 μm for (D) to (F).

