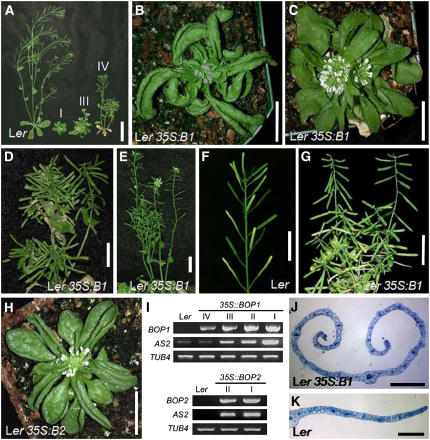
Figure 1.
Phenotypes of BOP1 and BOP2 Overexpressor Plants.
(A) Phenotypic variation among 35S:BOP1 (35S:B1) plants. From left to right: Ler wild-type (Ler), 35S:BOP1 class I (I), class III (III), and class IV (IV) transgenic plants.
(B) to (E) Class I (B), class II (C), class III (D), and class IV (E) 35S:BOP1 transgenic plants.
(F) and (G) Inflorescence development in Ler wild-type (F) and 35S:BOP1 (G) plants.
(H) 35S:BOP2 transgenic plant (35S:B2).
(I) BOP1, BOP2, and AS2 expression in 35S:BOP1 and 35S:BOP2 plants. RNA was isolated from the leaves of 35-d-old 35S:BOP1 T1 plants displaying class I, class II, class III, or class IV phenotypes or from 35-d-old 35S:BOP2 T1 plants displaying class I or class II phenotypes. TUBULIN4 (TUB4) was used as a control.
(J) and (K) Cross section through a 35S:BOP1 (J) and a Ler (K) leaf.
Bars = 40 mm in (A), 10 mm in (B) to (H), and 1 mm in (J) and (K).

