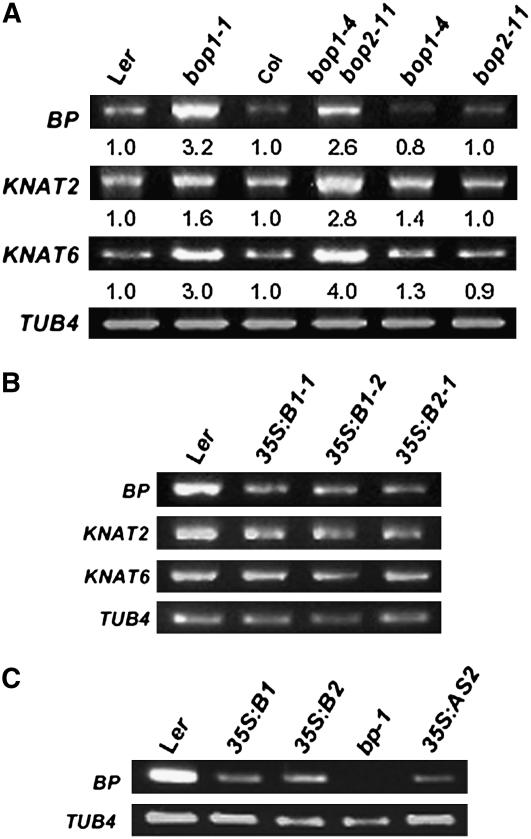
Figure 2.
Expression of Class I knox Genes.
(A) RT-PCR analysis of class I knox gene expression using RNA isolated from the shoot region of 12-d-old seedlings. The relative amount of transcript accumulation in the various genotypes is indicated below each image.
(B) RT-PCR analysis of class I knox gene expression using RNA isolated from the shoot region of 25-d-old plants. 35S:B1-1, 35S:B1-2, and 35S:B2-1 represent independent transgenic lines.
(C) RT-PCR analysis of BP expression in the stem region. TUB4 was used as a control.

