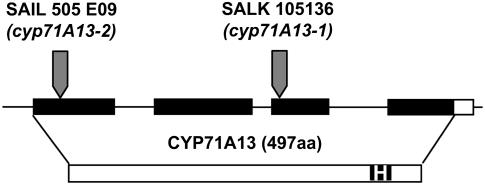
Figure 1.
Positions of T-DNA Insertions in At2g30770.
The gene model from The Arabidopsis Information Resource (www.arabidopsis.org) is shown. Exons are represented by rectangles and introns and untranscribed regions by lines. Black fill indicates translated sequences. The protein sequence is represented by the bottom rectangle. The filled region labeled “H” represents the heme-iron ligand signature. Positions of the T-DNA insertions are indicated by arrows. aa, amino acids.

