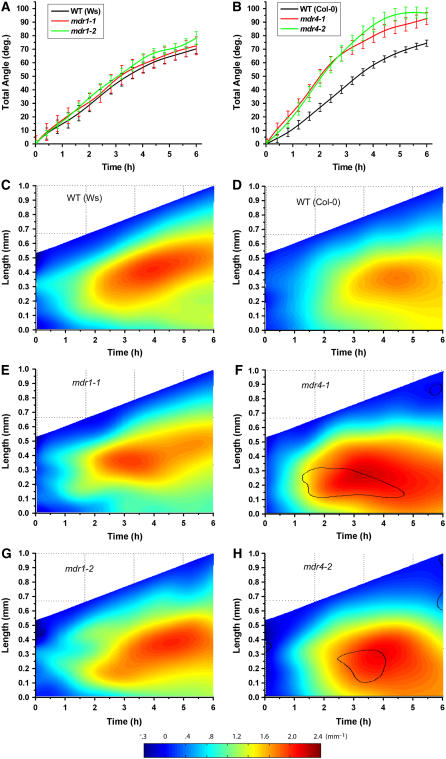
Figure 4.
Gravitropism of Wild-Type, mdr1, and mdr4 Roots Quantified with Computational Morphometrics.
(A) Total angle of the root is plotted versus time after reorientation for the wild type (n = 6) and two alleles of mdr1 (n = 7). There is no effect of the mutation.
(B) Total angle of the root is plotted versus time after reorientation for the wild type (n = 8) and two alleles of mdr4 (n = 10) ± se. The mutants respond faster and to a greater extent than the wild type.
(C) Spatiotemporal distribution of gravitropic curvature (K) in the Ws wild type. Length of the root axis is plotted in the y-dimension, and time is plotted along the x-dimension. K is color-coded and plotted in the z-dimension. Straight areas of the root are shown in cool colors, and curvature is shown as warm colors, as shown by the horizontal color scale bar. Shown is the average of six [0] individual roots.
(D) Spatiotemporal distribution of gravitropic curvature of Col wild-type roots, with an average of eight individuals.
(E) and (G) Spatiotemporal distribution of gravitropic curvature of mdr1 roots, with an average of seven individuals. The mdr1 mutations did not affect the response.
(F) and (H) Spatiotemporal distribution of gravitropic curvature of mdr4 roots, with an average of 10 individuals. The area of main curvature is shifted basally relative to the wild type. The black contour lines demark areas where the difference between the mutant and the wild type is significant to a level of P = 0.05.

