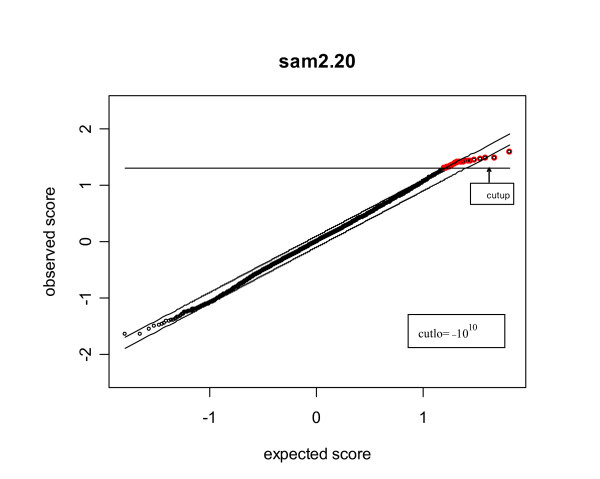
Figure 2.
The sam plot obtained from sam2.20. The red points are the points declared significant by sam2.20. The horizontal line refers to the upper cutoff δU (=cutlup) from sam2.20. The horizontal line corresponding to the lower cutoff δL (=cutlo) does not show up in the plot since δL = -1010. The threshold Δ used is the same as that used in producing Figure 1.

