
Fig. 1.
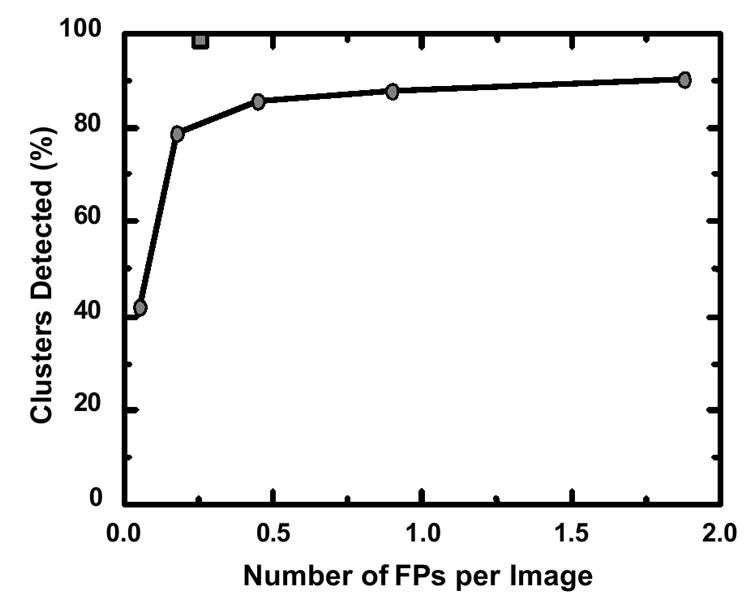
Comparison of the previous performance level marked by circles (87% sensitivity at 1.0 false positive per image) in the detection of clustered microcalcifications by computer in 1993, when the CAD technology was licensed to a company, with the estimated current performance level, marked by a gray square (98% sensitivity at 0.25 false positive per image), of the latest commercial CAD system.