Fig. 3.
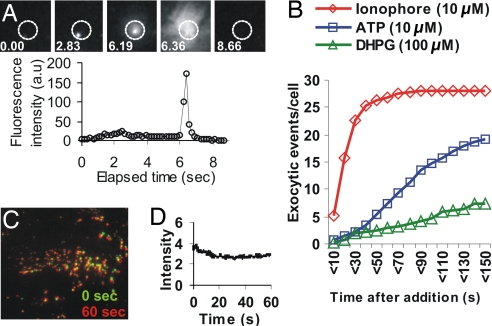
Imaging lysosomal exocytosis using FITC-dextran. (A) Astrocytes whose lysosomes were loaded with FITC-dextran were imaged by TIR-FM. Images show a region where, after ionophore addition, a lysosome moved closer to the membrane and released the dextran. (B) The exocytosis of lysosomes, as assayed by FITC-dextran release in TIR-FM, was quantified after the addition of agents that raise cellular calcium (for each curve, n > 5). DHPG, (R,S)-3,5-dihydroxyphenylglycine. (C) Astrocytes whose lysosomes are labeled with 70-kDa FITC-dextran were imaged (525/50 bandpass emission filter) by TIR-FM under conditions similar to AO imaging. The overlay shows that all the vesicles present at the start of imaging (green) are also present after 60 seconds (red) of constant TIR-FM illumination. (D) Quantification of FITC-dextran fluorescence over time, of the imaging field in C.

