Fig. 4.
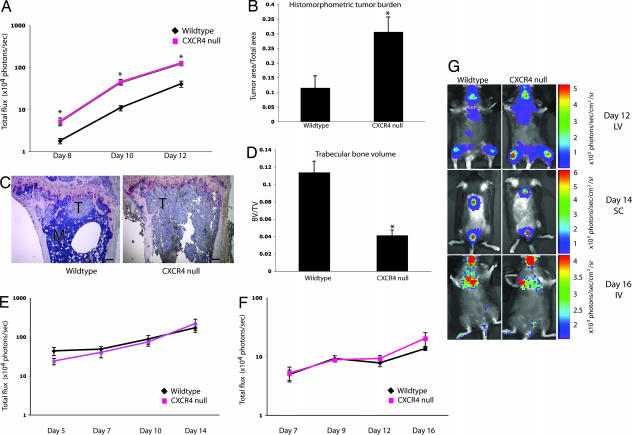
Tumor growth is increased in bone but not in lung or s.c. tissue of CXCR4−/− mice. (A) In vivo bioluminescence imaging after LV injection of B16-FL cells. Photon flux was quantitated in fixed region of interest (ROI) in the tibia/femur bones. *, P < 0.008 at all time points, two-tailed t test; n = 11 WT, n = 12 CXCR4−/−. (B) Histomorphometric analysis of tumor area/total area from tibial bones. *, P = 0.006; two-tailed t test. (C) Representative images of tibial bone sections (T = tumor). (Scale bars: 150 μm.) (D) Trabecular bone volume/total volume (BV/TV) measured from tibial bones. *, P = 0.0003, two-tailed t test. (E) In vivo bioluminescence imaging after s.c. injection of B16-FL. Photon flux was quantitated in fixed ROI in the dorsal tumors. P = 0.1 day 5, P = 0.5 day 7, P = 0.6 day 10, P = 0.4 day 14, two-tailed t test; n = 5 WT, n = 5 CXCR4−/−). (F) In vivo bioluminescence imaging after i.v. injection of B16-FL. Photon flux was quantitated in fixed ROI in the lung area. P = 0.8 day 7, P = 0.7 day 9, P = 0.4 day 12, P = 0.1 day 16, two-tailed t test; n = 5 WT, n = 5 CXCR4−/−. (G) Representative images of WT (Left) vs. CXCR4−/− (Right) mice on the final day of imaging from each tumor experiment. (Top) Day 12 LV. (Middle) Day 14 s.c. (Bottom) Day 16 i.v.

