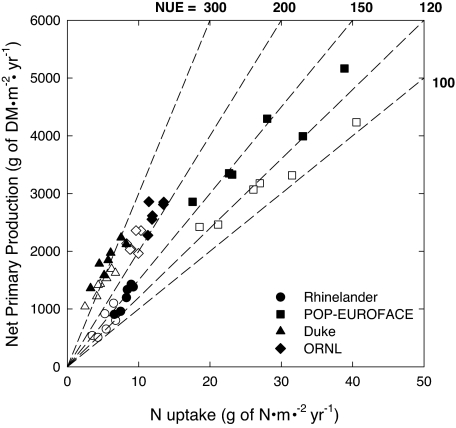
Fig. 1.
Correlation between N uptake (g of N·m−2·yr−1) and NPP (g·m−2·yr−1) at each of the four forest FACE sites under present-day (open symbols) and elevated (filled symbols) CO2. The data points represent the mean values in present-day and elevated CO2 in different years and in different species (POP-EUROFACE) or species assemblages (Rhinelander FACE). The dashed lines across the plot are isopleths of differing NUE ranging from 100 to 300.

