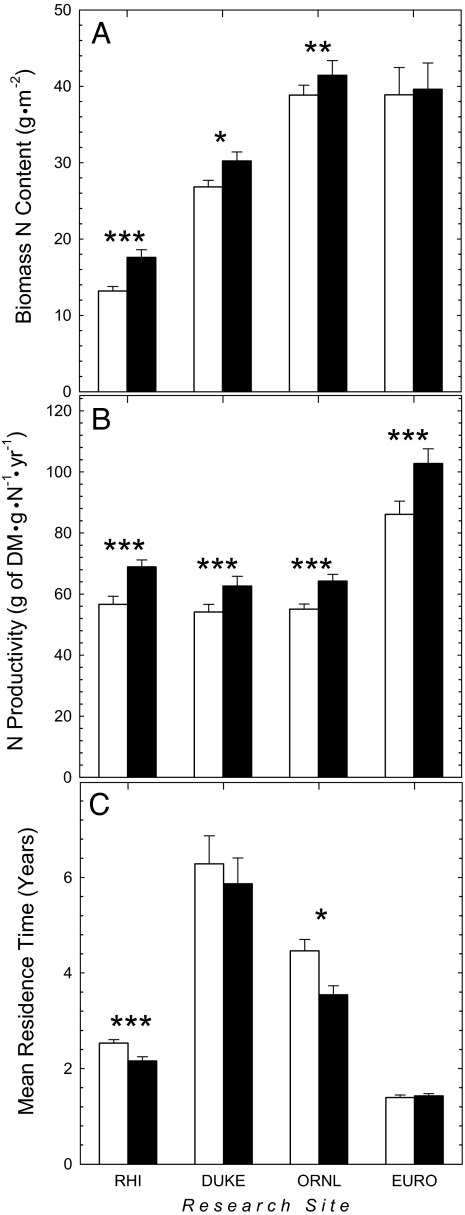
Fig. 3.
Responses of N content (A), N productivity (B), and MRT (C) of N in biomass to forest growth under present-day and elevated CO2 at the Rhinelander (RHI), Duke, ORNL, and POP-EUROFACE (EURO) sites. The error bar corresponds to one standard error of the mean. Levels of statistical significance for within-site responses to CO2 treatment are the same as those in Fig. 2.

