Fig. 4.
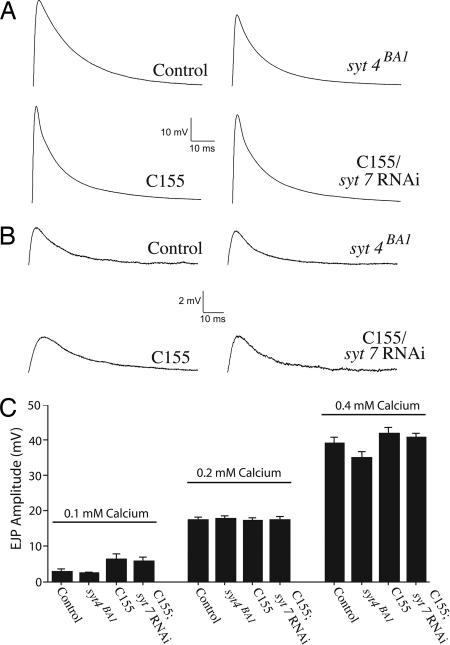
Evoked neurotransmitter release in animals lacking Syt4 and Syt7. (A) Representative traces of evoked EJP at 0.4 mM extracellular Ca2+ in control and syt4BA1 mutants, as well as control (C155) and C155; syt7 RNAi knockdown animals. (B) Representative traces of evoked EJP at 0.1 mM extracellular Ca2+ in control and syt4BA1 mutants, as well as control (C155) and C155; syt7 RNAi knockdown animals. (C) Quantification of evoked EJP amplitudes in control and syt4null mutants, as well as control (c155) and C155; syt7 RNAi knockdown animals at 0.1, 0.2, and 0.4 mM extracellular Ca2+. Data points are mean ± SEM. The numbers of muscles examined and the average resting potential (avg. RP) in millivolts ± SEM for each genotype were as follows: control (0.1 mM Ca2+, n = 10, avg. RP = −64 ± 1.27; 0.2 mM Ca2+, n = 14, avg. RP = −60.3 ± 1.18; 0.4 mM Ca2+, n = 9, avg. RP = −69 ± 2), syt4null (0.1 mM Ca2+, n = 9, avg. RP = −68 ± 2.33; 0.2 mM Ca2+, n = 18, avg. RP = −59.43 ± 0.92; 0.4 mM Ca2+, n = 9, avg. RP = −66 ± 1.67), C155 (0.1 mM Ca2+, n = 8, avg. RP = −62 ± 2.12; 0.2 mM Ca2+, n = 30, avg. RP = −59 ± 0.7; 0.4 mM Ca2+, n = 9, avg. RP = −75 ± 2), and C155; syt7 RNAi (0.1 mM Ca2+, n = 8, avg. RP = −62 ± 1.41; 0.2 mM Ca2+, n = 26, avg. RP = −59.02 ± 0.82; 0.4 mM Ca2+, n = 9, avg. RP = −73 ± 1).

