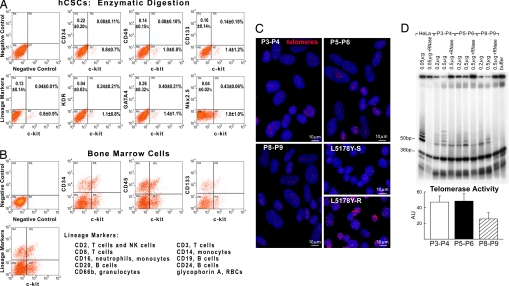
Fig. 2.
Human CSCs. (A and B) Scatter plots of hCSCs (A) and human bone marrow cells (B). hCSCs do not express hematopoietic markers, KDR, GATA4, and Nkx2.5. (C) Nuclei (blue) of hCSCs were stained with a telomere probe (magenta). Lymphoma cells with short (7-kbp) and long (48-kbp) telomeres are shown for comparison. (D) Products of telomerase activity in hCSCs start at 50 bp and display a 6-bp periodicity. Samples treated with RNase and CHAPS buffer were used as negative controls, and HeLa cells were used as positive control. The band at 36 bp corresponds to an internal control for PCR efficiency. Optical density (arbitrary units, AU) is shown as mean ± SD.

