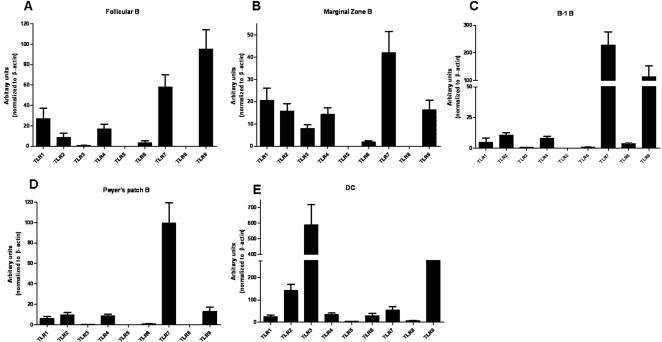
Figure 1. TLR expression profile of murine B-cell subsets.
Real-time PCR profile of TLR expression in FACS sorted follicular B-cells (CD19+ B220+CD23+CD21−, panel A), marginal Zone B (CD19+ B220+CD23−CD21+, panel B), peritoneal B-1 (CD19+B220+CD23−, panel C) and peyer's patch B cells (CD19+B220+, panel D) as indicated with β-actin as loading control. CD11c+ dendritic cells were used as a positive control (panel E). Values represent the ratio of the TLR to β-actin.

