Figure 1.
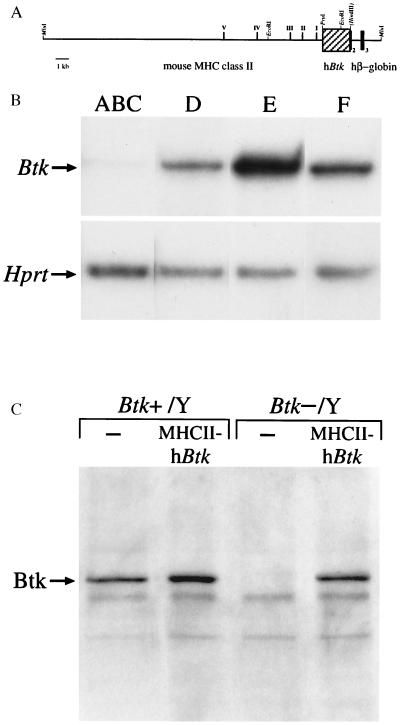
Structure and expression of the MHCII–hBtk transgene. (A) Map of the transgene construct, showing the locations of five DNase I hypersensitive sites present in the 23-kb MluI–PvuI mouse MHC class II upstream Ea gene fragment, the 2.1-kb PvuI–HindIII hBtk cDNA fragment (hatched box), as well as a 2.8-kb hβ-globin fragment containing part of exon 2, exon 3, and 3′ untranslated region. (B) RT-PCR analyses of MHCII–hBtk transgene expression during B cell development. cDNA samples were prepared from sorted bone marrow populations of MHCII–hBtk transgenic Btk−/Y mice and yields were normalized using ≈250 bp HPRT RT-PCR products. The MHCII–hBtk transgene primers generated single ≈230-bp bands, with the following densities (relative to fraction E): lane ABC, B220+CD43+IgM− pro-B cells (28): 1.8%; lane D, B220+CD43−IgM− pre-B cells: 25%; lane E, B220+IgM+ immature B cells: 100%; and lane F, B220highIgM+ mature B cells: 35%. Data are shown as a representative of three mice examined. (C) Western blot analysis of Btk expression in total cell lysates from spleen of 3-month-old male wild-type mice (Btk+/Y) or Btk-deficient mice (Btk−/Y), either nontransgenic or MHCII–hBtk transgenic. The position of the 77-kDa Btk band is indicated.

