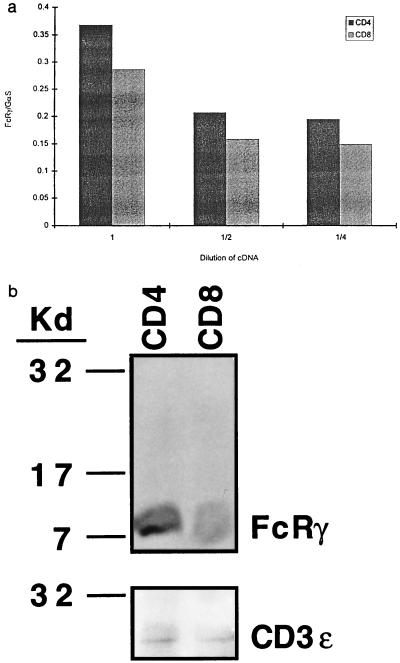
Figure 2.
(a) Mature CD4+ T cells expressed more transcripts of the transgene than mature CD8+ T cells. Comparison of the amount of PCR-amplified cDNA of CD4+ and CD8+ T cells from FcRγTG mice was made at three different cDNA dilutions, at which the amplified DNA band intensities of a reference cDNA, GαS, were comparable. The FcRγ PCR product is the lower band. The y axis represents arbitrary units of the ratio of DNA band intensity of FcRγ and GαS. (b) Mature CD4+ T cells expressed the same, if not more, FcRγ protein as CD8+ T cells. Whole cell lysates of 5 × 10⁶ CD4+ or CD8+ cells were run on reducing SDS/PAGE, blotted, and probed with anti-FcRγ antibody as described. After detection, the membranes were stripped and reblotted with anti-CD3 ɛ antisera.

