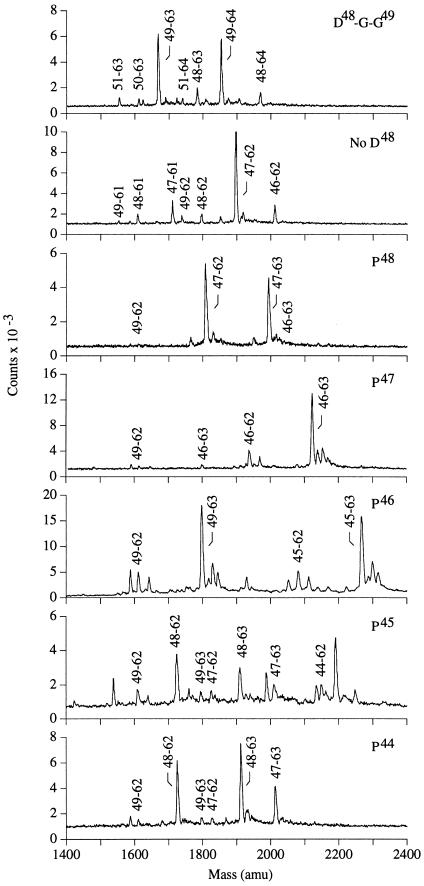
Figure 3.
Mass spectrum of HEL 52–61 containing peptides recovered from the mHEL mutants. Each panel corresponds to a different mHEL mutant. For each mutant, the sample was obtained by mixing an equal amount from all the HPLC fractions able to stimulate the HEL 52–61 reactive T cell hybridoma, 3A9. The observed mass and relative yield of each HEL fragment is given in Table 2.

