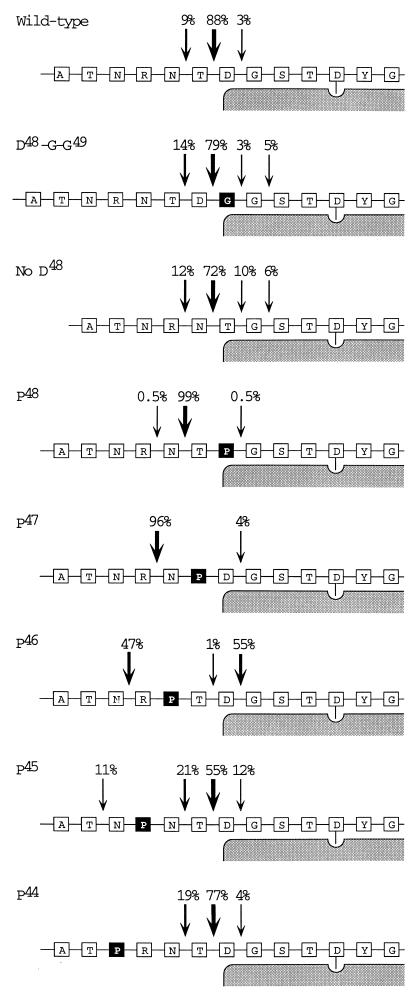
Figure 4.
Summary of HEL peptides presented by the different mHEL transfectants. Each series of boxes represents a different mHEL mutant, with the amino acid sequence given in single letter code. The shaded region represents the MHC class II molecule. The aspartic acid anchor at P1 (Asp-52) is shown with its side chain extending into the class II molecule. The amino acids altered by site-directed mutagenesis are shown as dark boxes. Arrows point to the amino termini of the recovered peptides. Percentages, given above each arrow, were obtained by integration of mass spectra as described in Fig. 2b and Table 1.

