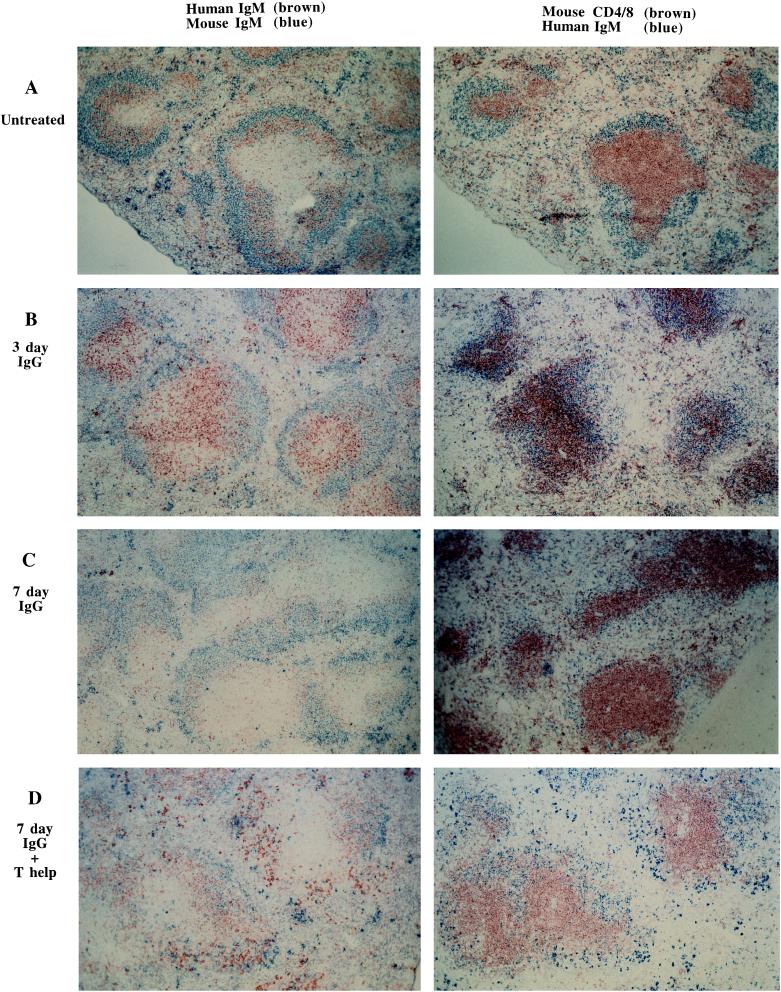
Figure 2.
Effect of encounter with soluble hIgG on the distribution of hIgM RF-expressing B cells in the spleen. (A–D) Immunohistochemical analysis of spleen sections from either uninjected AB29 mice (A) or AB29 mice, 3 days (B), or 7 days (C) after i.p. injection of 2 mg DHGG or 7 days after i.p. injection of DHGG and i.v. injection of 20 × 106 C57BL/6bm12 splenocytes. (D) (Low power views, ×100.)

