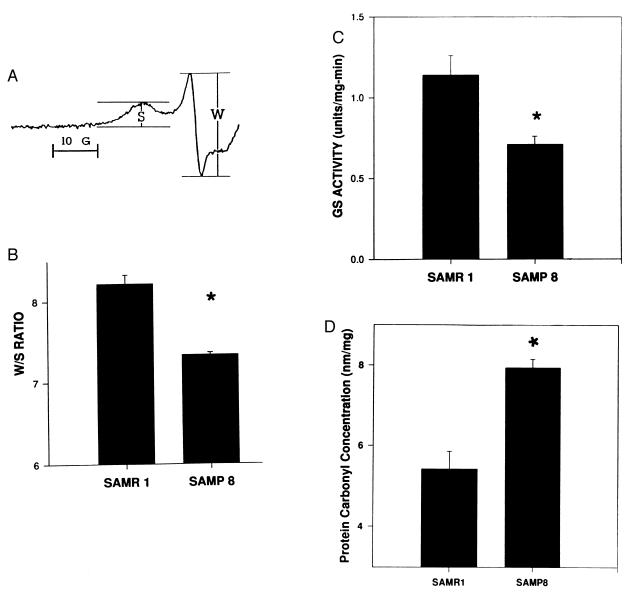
Figure 1.
(A) Typical MI = +1 low-field EPR line of MAL-6-labeled synaptosomal membrane proteins showing the W and S spectral components. (B) Data represent the average W/S ratio of MAL-6 covalently bound to proteins in cortical synaptosomal membranes from SAMR1 and SAMP8 mice. Error bars indicate SEM for nine and three animals, respectively. ∗, P < 0.002. (C) Data represent the average cortical GS activity of SAMR1 and SAMP8 mice. Error bars indicate SEM for nine and three animals, respectively. ∗, P < 0.05. (D) Data represent the average protein carbonyl content of cortical proteins from SAMR1 and SAMP8 mice. Error bars indicate SEM for six and three animals, respectively. ∗, P < 0.001.

