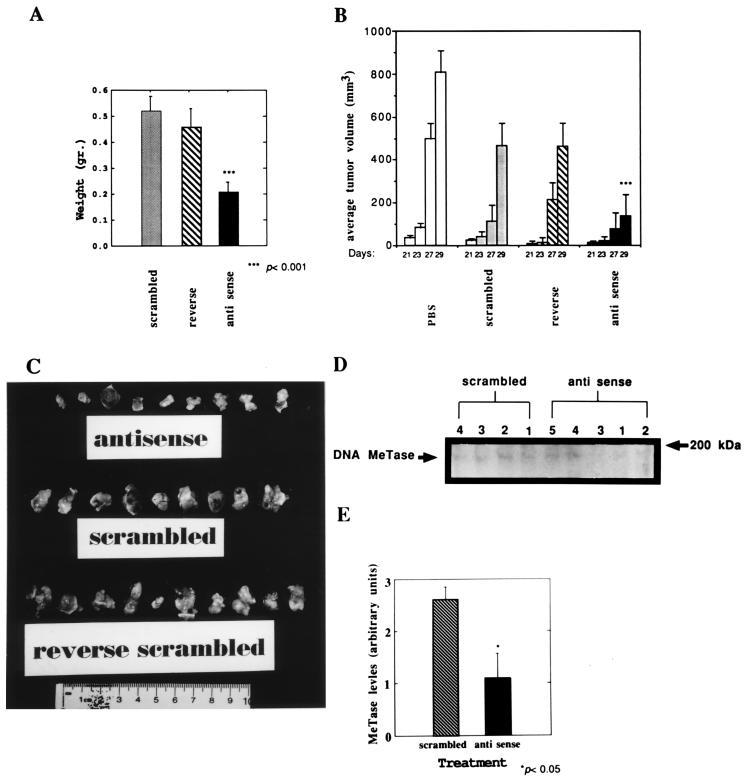
Figure 2.
DNA MeTase antisense oligodeoxynucleotide inhibits tumor growth in vivo. (A) Average weight of tumors isolated from LAF1 mice bearing Y1 tumors that were injected with antisense, scrambled, or reverse oligodeoxynucleotide (5 mg/kg) every 48 h for 29 days. The results are presented as an average ± SEM. The statistical significance of the difference between the scrambled or reverse groups and the antisense group was determined by a Student’s t test to be P < 0.001. There was no statistically significant difference between the two control groups (P > 0.5). (B) Average volume of tumors determined as described at the indicated time points postimplantation [determined as described in Plumb et al. (42)]. (C) Photograph of the tumors removed from the antisense, reverse, and scrambled oligodeoxynucleotide-treated mice described above. (D) LAF1 mice bearing Y1 tumors were injected with 5 mg/kg scrambled (n = 4) or antisense (n = 5) oligodeoxynucleotides three times every 24 h s.c. Tumors were removed from each mouse (indicated by serial numbers 1–4 for the scrambled group and 1–5 for the antisense group), and nuclear extracts prepared from the tumors were subjected to a Western blot analysis as described. The band corresponding to the DNA MeTase is indicated by an arrow. The amount of signal corresponding to the DNA MeTase (OD arbitrary units) was normalized to the level of total protein transferred onto the membrane as determined by Amido black staining and quantified by scanning (OD arbitrary units). The values obtained (OD of DNA MeTase signal divided by OD of the total protein staining) for the tumors extracted from each of the treated mice (serial number of mice in bold) were as follows: scrambled: 1, 2.2; 2, 3.1; 3, 2.7; and 4, 2.5: antisense: 1, 0.6; 2, 0.5; 3, 0.16; 4, 1.0; and 5, 2.9. (E) Average DNA MeTase level per group is plotted with the SEM. The difference between the scrambled and antisense groups was determined by a Student’s t test to be statistically significant (P < 0.05).

