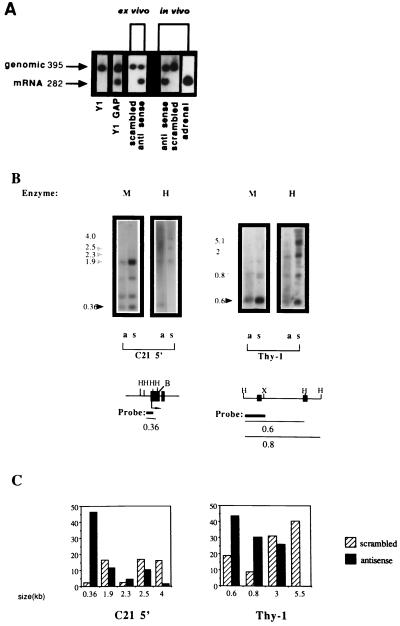
Figure 3.
Expression and demethylation of the C21 gene in Y1 tumors isolated from LAF1 mice treated with antisense oligodeoxynucleotides. (A) C21 expression was determined by reverse transcriptase–PCR amplification with C21-specific primers of total RNA isolated from Y1 cells, Y1GAP transfectants expressing hGAP (a GTPase- activating protein), an attenuator of Ras activity (28), Y1 cells treated with 20 μM of either scrambled oligodeoxynucleotide or DNA MeTase antisense oligodeoxynucleotides (ex vivo as indicated), Y1 tumors from LAF1 mice injected with either 5 mg/kg of scrambled or DNA MeTase antisense oligodeoxynucleotides (in vivo) as well as adrenal RNA. C21 plasmid DNA encoding the C21 gene (46) was included in the amplification reaction to control for nonspecific inhibition of amplification. The expected genomic and C21 mRNA amplification products are indicated by arrows. (B) DNA was extracted from Y1 tumors isolated from LAF1 mice injected with either scrambled oligodeoxynucleotides (scrambled 4, indicated as s) or antisense oligodeoxynucleotides (antisense 3, indicated as a) for 3 days as described. The DNA was subjected to HindIII digestion followed by either HpaII (H) (which cleaves the sequence CCGG when the internal C is not3 methylated) or MspI (M) (which cleaves the sequence CCGG even when the internal C is methylated) agarose gel fractionation (2.5%), Southern blotting analysis, and hybridization with the indicated probes. For the promoter region of the C21 gene, complete digestion of the gene should result in a 0.36-kb fragment (46), as indicated by the dark arrow. The partially methylated fragments are indicated by shaded arrows. The partial cleavage with MspI is a consequence of the fact that the MspI sites are nested within a HaeIII site. These sites are highly resistant to cleavage by MspI when fully or partially methylated, as described (47). For Thy-1, DNA prepared from the tumors indicated was subjected to a similar HpaII–MspI restriction enzyme analysis and hybridization with a 0.36 probe from the 5′ region of the thy-1 gene (48). The expected HpaII fragment is indicated by a dark arrow. Partially methylated fragments are indicated by shaded arrows. (Lower) Physical maps of the sequences analyzed for their methylation state. The first exons of the three genes are shown and are indicated as filled boxes, the probes used are indicated as thick lines, and the thin line indicates the expected nonmethylated and partially methylated HpaII fragments. (X, XbaI; B, BamHI). (C) Relative abundance of the HpaII fragments was determined by densitometry as described. The size in kilobases of the scanned fragments is indicated. The results are presented as intensity of a specific fragment as a percentage of the total intensity in all scanned fragments per lane.

