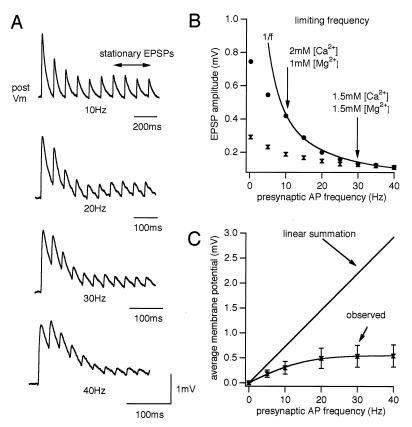
Figure 2.
Frequency-dependent synaptic depression. (A) Recorded EPSPs generated by presynaptic spike trains at various frequencies (same neuron, average of 20 sweeps). (B) Stationary EPSPs in 2 mM [Ca2+]out (•) and 1.5 mM [Ca2+]out (⧗), same synapse. The solid line shows the inverse relationship with frequency. This effect of lowering [Ca2+]out on the limiting frequency was observed in all four synaptic connections tested. (C) Time-averaged membrane potential in postsynaptic neurons during the last four EPSPs, relative to resting potential as a function of presynaptic AP frequency (seven synapses; observed). (Bars = SD.)

