Figure 1.
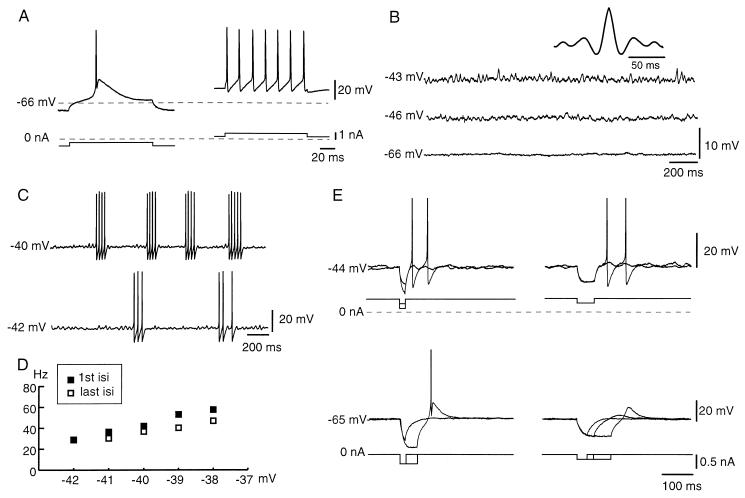
Fast oscillations in TCNs. (A) Direct activation of a thalamic cell from two levels of membrane potential. The labeled −66-mV broken line indicates the resting membrane potential. (B) In the same cell, subthreshold oscillations at two different levels of membrane potential induced by outward dc injection. The dominant frequency at −43 mV was 37.5 Hz (see Inset, autocorrelogram). (C) High-frequency trains of spikes induced by increasing dc injection. Note that the spikes are triggered at the same frequency as the subthreshold oscillations. (Filtering of the traces at 2 kHz reduced the amplitude of the spikes.) (D) Corresponding graph of discharge frequency vs. membrane potential. The rate of discharges are in the gamma band. isi, inter-spike interval. (E) Oscillations are reset (upper traces) by brief hyperpolarizations induced by the injection of short-duration inward current pulses. (Lower traces) Low-threshold spikes can be induced by outward current pulses of longer duration or higher amplitudes than those in upper traces, even from resting membrane potential (−65 mV).

