
Figure 3. Forced swim test in the animals before and after rapid kindling.
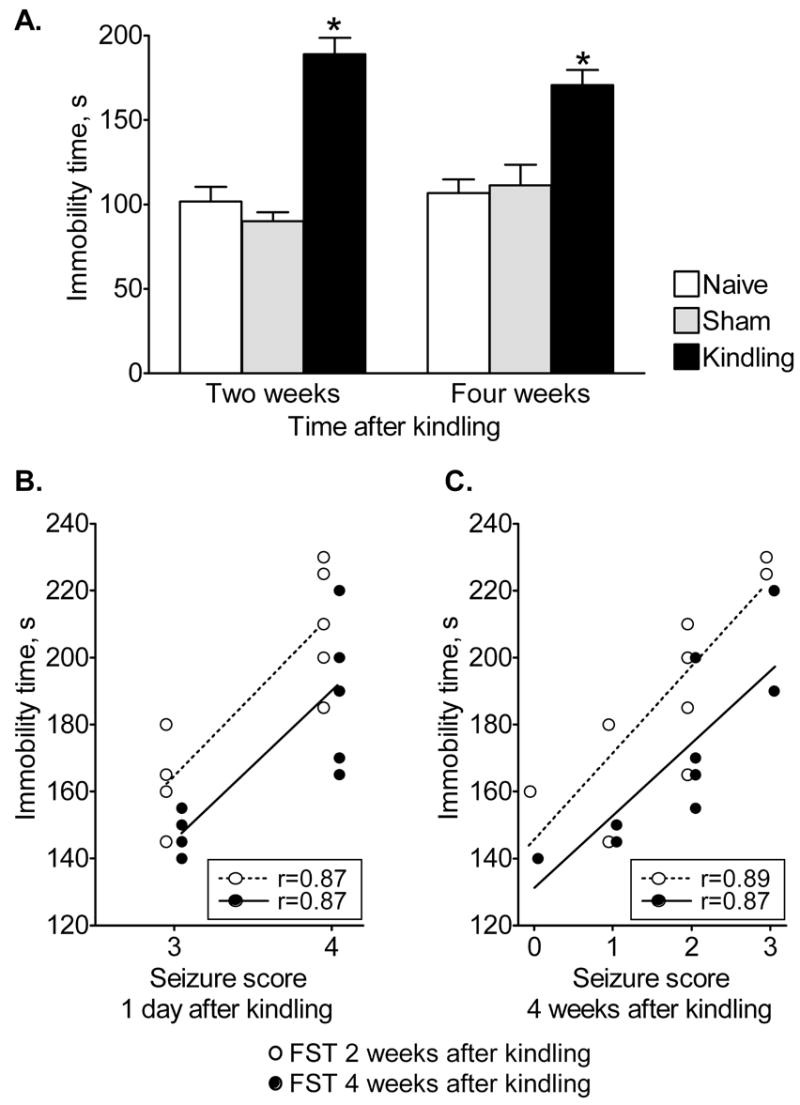
A. Mean±SEM values two and four weeks after kindling. *-p<0.05 vs. both naïve and sham (One-way ANOVA+Bonferroni test). There were no statistical differences (p>0.1) between two and four weeks for any of groups (paired t-test). Seizure score in individual animals in response to threshold stimulation one day (B) and four weeks (C) after kindling is plotted against immobility time in FST 2 weeks (open circles) and 4 weeks (black circles) after kindling. Coefficient of correlation (r) was calculated using Spearman test, is indicated for each of the data set; positive correlation was statistically significant in all cases (p<0.05).