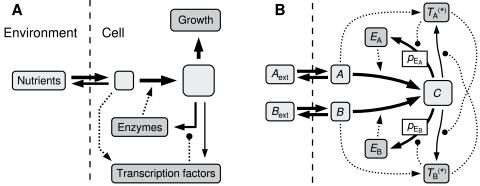
Figure 1. A) A general view of an organism with one or more metabolic pathways.
Solid lines represent the flow of biomass, while dotted lines show regulatory interactions, with arrows for positive regulation and circles where the sign of the regulation can be varied. Nutrients are transported into the cell, processed by enzymes, and spent on cell growth and on replenishing the enzymes. Optionally, transcription factors may detect the presence of nutrients and regulate the enzyme production accordingly. B) A sketch of the most complete model considered here, where two nutrients, A and B, are turned into C by their respective enzymes, EX. Nutrients inside the cell activate the transcription factors, TX→T* X, which in turn activate or repress the production of enzymes and each other. For parts of this paper, pieces of the model are removed, including the entire B side. When the transcription factors are excluded, the rate constants p EA and p EB control the production of enzymes.

