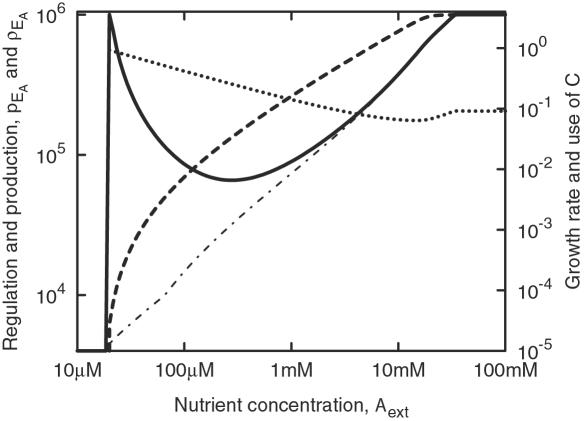
Figure 3. The transcriptional regulation, p EA, that maximizes the growth rate of figure 2 (solid) and the corresponding actual enzyme production rate, p EA (dot-dashed), in units of molecules per cell and second.
Also shown are the growth rate as fraction per hour (dashed, right scale) and the cost of producing the enzyme EA, expressed in terms of the total resource expenditure (dotted line, right scale).

