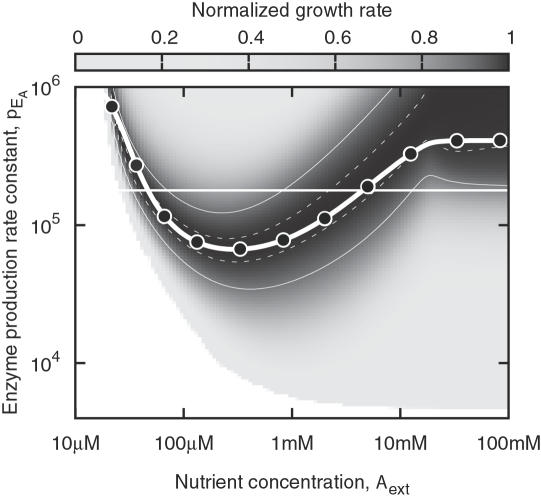
Figure 4. The behavior of a cell with well-tuned transcriptional regulation of the enzyme production.
The normalized growth rate (see figure 2) was optimized for those A ext indicated by points, with an equal number of generations spent in each environment. The resulting system responds to A ext as indicated by the thick curve. For comparison, the straight white line shows the best p EA in absence of regulation.

