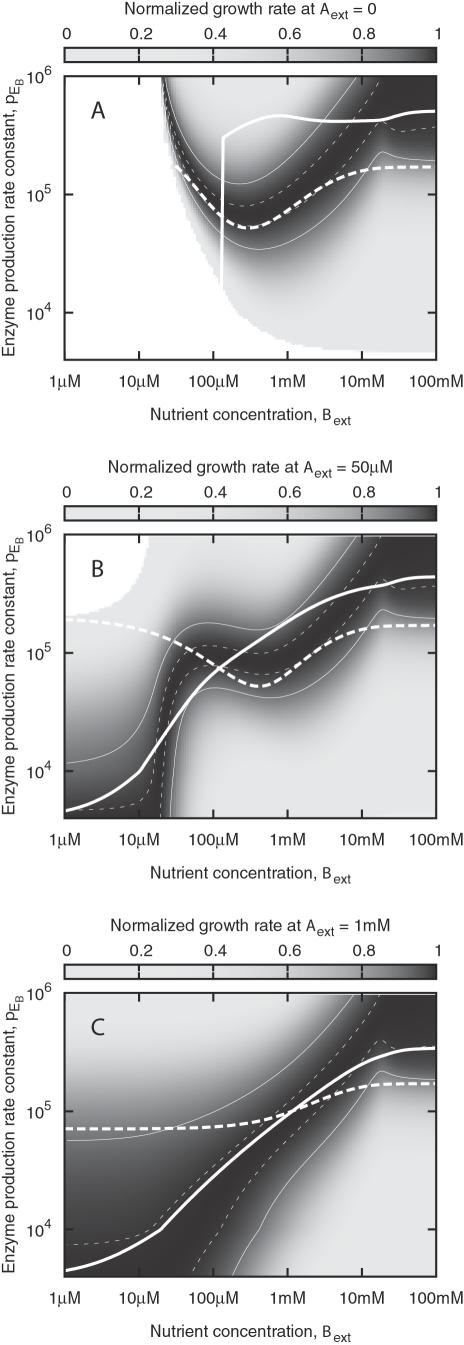
Figure 5. Growth rate as a function of the activation of a second metabolic pathway, presented as in figure 2.
In each plot, the level of metabolite B is varied, while metabolite A is present at a constant level, and p EA is pegged at its optimal value in absence of B. The sharp transition of the optimal p EB in (B) signals a need for nonlinearity when p EB is actively regulated. The thick lines indicate what the simple transcriptional network of figure 1(B) can accomplish, when optimized over a wide range of environments, either emphasizing high (solid) or low (dashed) nutrient levels. Comparison with figure 4 shows that it is far more difficult to achieve near-optimal regulation when the second metabolic pathway is added.

