Figure 3.

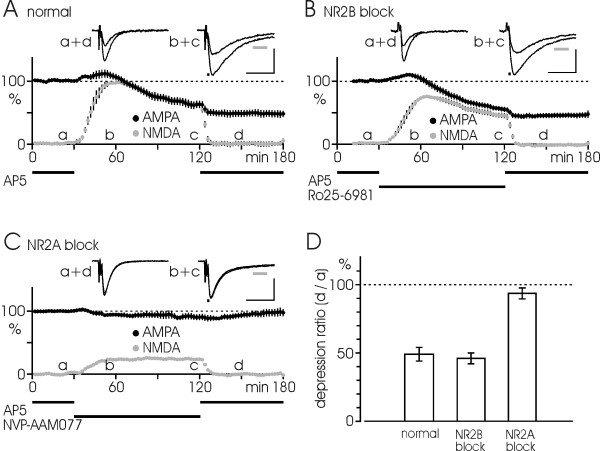
Roles of NR2B and NR2A subunits in stimulus-induced LTD. (A) A "slow LTD" is induced by 0.1 Hz test rate stimulation for 90 min in a low Mg2+ solution. The experiment consists of preinduction baseline level in presence of a high concentration of AP5 (50 μM), induction period in AP5-free solution, and established LTD after reintroduction of high AP5. AMPA component (black symbols) and NMDA component (gray symbols) are plotted as functions of time, each point indicating the average in 2 min (n = 8 experiments). (B) A similar result is obtained in the same type of experiment but treated with Ro25-6981 (0.5 μM; n = 8) during the induction period. (C) The "slow LTD" is substantially blocked when NVP-AAM077 (0.4 μM; n = 7) is present under induction in AP5-free solution. (D) Bar diagram shows the "slow LTD" at 30 min after reintroducing AP5, plotted as percentage of the preinduction level under the three different experimental situations in A-C. Data are mean ± S.E.M. Black bars in A-C indicate the duration of drug treatment. Inserts show the EPSP-traces taken at the indicated time points (a-d) and the timing of the measurements for AMPA and NMDA components (0–1.5 ms after fiber volley and at 35–45 ms, respectively; see bars below traces). Calibrations: 0.2 mV, 20 ms.
