
Figure 4.
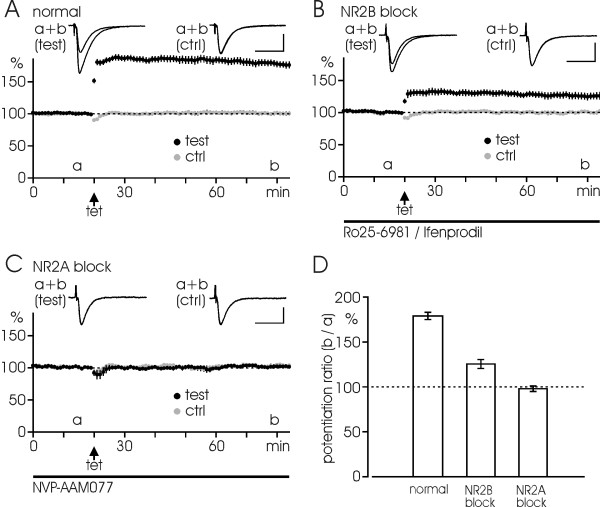
Roles of NR2B and NR2A subunits in LTP. (A) LTP induced by three successive tetani (100 Hz, 100 impulses each) in normal solution. The EPSP is potentiated to a near doubling of the initial response. Test pathway (black symbols) and control pathway (gray symbols) are plotted as functions of time, each point indicating the average in 1 min (n = 10 experiments). (B) LTP is partially blocked by Ro25-6981 (0.5 μM; n = 2)/Ifenprodil (3 μM; n = 4) (total n = 6). (C) LTP is fully prevented when NVP-AAM077 (0.4 μM) is present (n = 5). (D) Bar diagram summarizes the data in A-C with mean ± S.E.M. LTP is measured at 60 min after tetanization relative to the initial baseline. Arrows in A-C indicate the tetani. Black bars indicate the duration of drug application. Inserts illustrate EPSP-traces taken at the indicated time points (a, b). Calibrations: 0.5 mV, 20 ms.