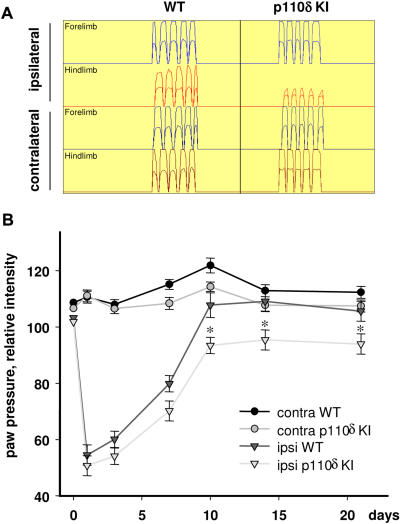
Figure 5. Impaired functional recovery in p110δ KI mice following sciatic nerve crush injury.
Paw pressure intensity during continuous locomotion was assessed using the CatWalk quantitative gait analysis system. Recovery in locomotion was analyzed on days 1, 3, 7, 10, 14 and 21 post-injury. (A) Intensity profiles of 5 steps during a single run from each paw, 7 days post-injury. Each intensity profile shows two traces, a higher trace of the maximal relative intensity and a lower trace of the average relative intensity. (B) Reduced relative paw pressure intensity for each paw during recovery in p110δ KI mice compared to WT mice. Data presented is the mean±SEM of ≥6 animals. p<0.001, 2-way repeated measures ANOVA.

