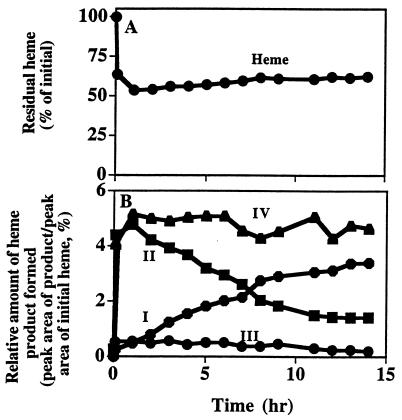
Figure 2.
Kinetics of heme loss and formation of altered heme products. (A) Amount of residual heme after treatment of metmyoglobin with H2O2. (B) Relative amount of heme products formed from the treatment of metmyoglobin with H2O2. The preparation and analysis of the samples are as described in Fig. 1. The relative amounts of heme metabolites were quantified by peak areas at 400 nm and expressed as a percentage of the peak area of heme at 400 nm of the untreated sample. The values are relative amounts since the absorptivities of the products are not known. The Roman numerals correspond to the peaks indicated in Fig. 1.

