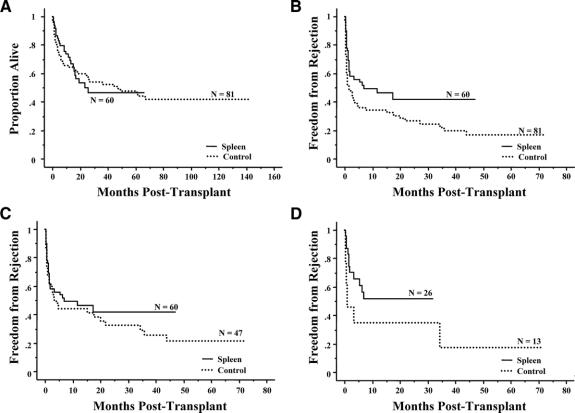
FIGURE 1. A, Kaplan-Meier comparison of patient survival between patients who received (N = 60, 25 deaths) versus did not receive a spleen (N = 81, 42 deaths) (P = 0.98). B, Kaplan-Meier freedom-from-rejection comparison between patients who received (N = 60, 29 failures) versus did not receive a spleen (N = 81, 57 failures) (P = 0.02). C, Kaplan-Meier freedom-from-rejection comparison of patients transplanted since 2001 between those who received (N = 60, 29 failures) versus did not receive a spleen (N = 47, 31 failures) (P = 0.39). D, Kaplan-Meier freedom-from-rejection comparison of children less than 1 year of age who underwent transplantation since 2001 and received (N = 26, 12 failures) versus did not receive a spleen (N = 13, 9 failures) (P = 0.07).

An official website of the United States government
Here's how you know
Official websites use .gov
A
.gov website belongs to an official
government organization in the United States.
Secure .gov websites use HTTPS
A lock (
) or https:// means you've safely
connected to the .gov website. Share sensitive
information only on official, secure websites.
