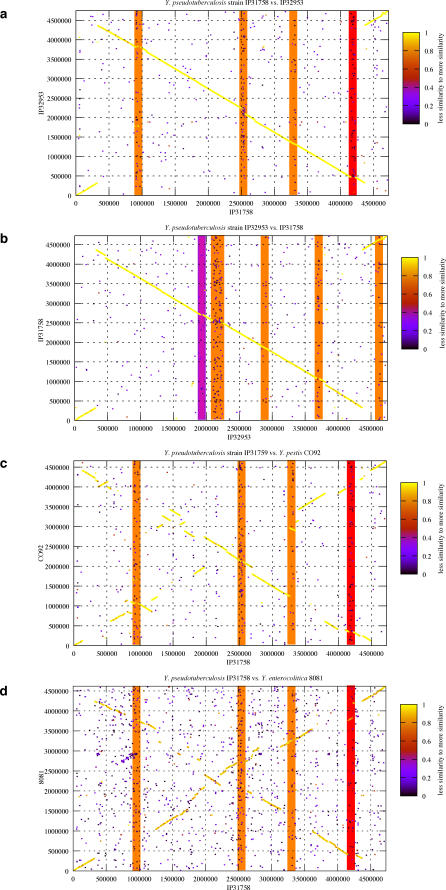
Figure 2. Genome Structure and Synteny.
(A) Y. pseudotuberculosis IP31758 compared to IP32953.
(B) Y. pseudotuberculosis IP32953 compared to IP31758.
(C) Y. pseudotuberculosis IP31758 compared to Y. pestis CO92.
(D) Y. pseudotuberculosis IP31758 compared to Y. enterocolitica 8081.
Each protein from the x-axis reference genome was queried using BLASTP for its presence in the y-axis query genome. For a match, the N-terminal coordinates of both proteins were plotted as x and y. The color represents the level of similarity of the match expressed by the BLAST score ratio [36]. Prophage insertions are highlighted in orange; the pathogenicity island YAPIIP31758 is highlighted in red; and HPIIP32953 is highlighted in purple.

