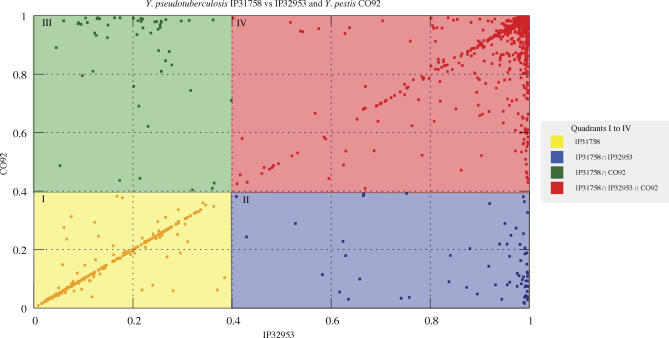
Figure 3. BLAST Score Ratio Analysis of Y. pseudotuberculosis Strains IP31758 and IP32953 and Y. pestis CO92.
BLAST score ratios were plotted as x,y coordinates. Each protein in the reference genome (Y. pseudotuberculosis IP31758) was grouped into four quadrants according to its scores in each of Y. pseudotuberculosis IP32953 and Y. pestis CO92 genomes and colored as follows: yellow (I), unique to IP31758; red (IV), common to all three; blue (II), common between IP31758 and IP32953 but absent in CO92; green (III), common between IP31758 and CO92 but absent in IP32953.

